Deflation Underway
The world might soon wake up to its consequences.
Last week we highlighted that the level of the European Central Bank’s bond assets, its balance sheet, was deflating on an annualized basis. The same deflation dynamic is occurring in the balance sheets of the Federal Reserve and the Bank of England as well. The minting of central bank money out of thin air, a consequence of the positive social mood that fueled asset markets over the last decade, has disappeared.
More deflation evidence comes in the form of overall money supply in the U.S., something that Robert Prechter highlighted in the December issue of the Elliott Wave Theorist.
An increase in the money stock is inflation and a decrease is deflation.
And now, a details alert! — The stock of “money” is calculated in different ways. So-called M1 consists of currency outside the U.S. Treasury, Federal Reserve Banks, and the vaults of depository institutions; demand deposits at commercial banks; and other liquid deposits, consisting of other checkable deposits and savings deposits (including money market deposit accounts). A broader measure, so-called M2, consists of M1 plus small-denomination time deposits (time deposits in amounts of less than $100,000) and balances in retail money market funds.
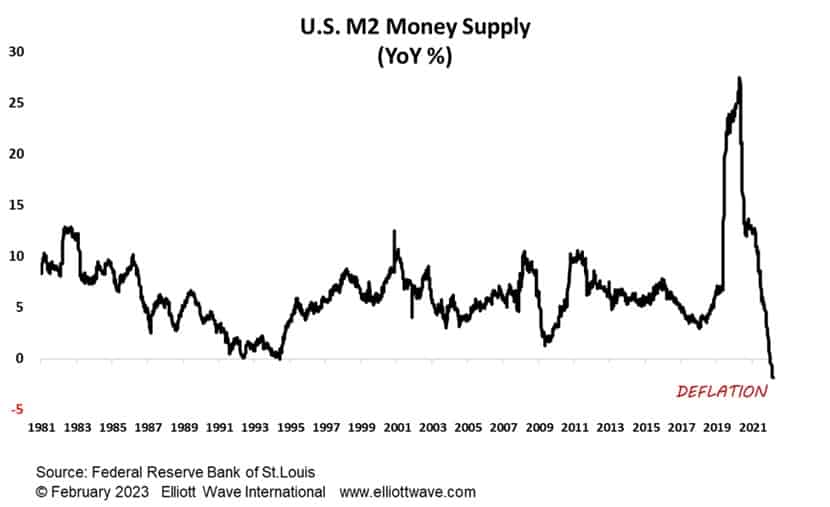
The chart below shows the annualized percentage change in M2 since 1981. Apart from a very brief (one week!) foray into negative territory in 1995, money supply in the U.S. has always been inflating. Now, though, money supply is deflating at a current annualized clip of nearly 2%. This historic and the now seven-week-long contraction in money on this basis looks like it is becoming embedded.
There is deflation in money. There is deflation in asset prices like bonds, stocks and property. Most people won’t recognize it for a long time to come, but the deflationary depression looks like it has begun.