Commodity Outlook Points to Slowing Price Rises
A clue from the price structure can give us an edge.
One of the advantages of the Elliott Wave Principle is that, due to its rules of wave formation, it enables us to anticipate which patterns could be forming in advance and therefore plan for subsequent price movements. In particular, knowing the different implications between a three-wave structure versus a five-wave structure can be very useful.
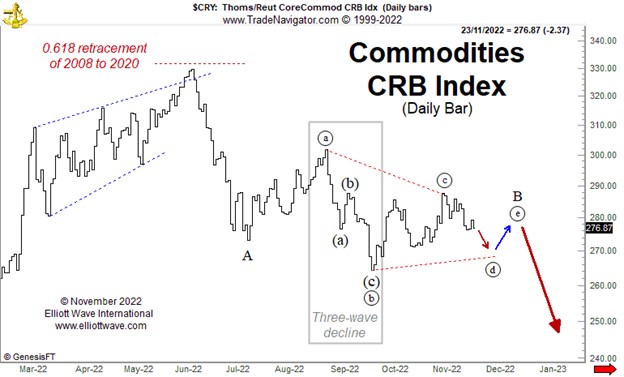
The chart below shows the Commodity Research Bureau (CRB) index which consists of a basket of the most-used commodities from aluminum, cocoa and coffee, to soybeans, sugar and wheat. The index topped out in June at almost exactly the 0.618 retracement of its entire decline from 2008 to 2020, a potential turning point that EWI had previously brought attention to.
The decline from June to September is noteworthy because, within it, the structure from June to July is better counted as five waves, while the drop from August to September is an unequivocal three-wave arrangement. This is important because it means that, given the catalogue of possible corrective patterns within the Wave Principle, the overall decline is probably not over. Either the August-September drop is wave ((b)) of a running triangle, or it is wave ((b)) of a flat pattern. In both cases, once the pattern is complete, another decline should ensue.
This is useful to know because it will mean a continued downward pressure on producer prices resulting in a continuation in the disinflationary trend that is underway. That will probably result in a soothing of central bank interest rate hike expectations, or for the cynics among you, a kinder, gentler torture.