Core blimey, guv’nor! Deflation looms.
This differential spells trouble.
When I was a rookie in the financial markets, I asked a colleague one day what was happening. “Greenspan’s got the Humphrey Hawkins,” she said. Now, this was a City of London trading floor, filled with East End cockneys and, for a while, I perused whether it was some sort of rhyming slang. Could Alan Greenspan have caught some sort of debilitating disease that rhymed with Humphrey Hawkins (who sounded like a suave film star from the 1950s)? Parkinson’s, perhaps.
I’m glad I held my tongue because I soon realized, of course, that she was referring to the Federal Reserve Chairman’s testimony to Congress that is mandated by the Humphrey-Hawkins Full Employment Act of 1978. Phew!
Last week, the current Fed Chairman, Jerome Powell, attended the most recent Humphrey-Hawkins hearings. During the question-and-answer session he reiterated the Fed’s commitment to looking at a different measure of consumer price inflation than the headline-grabbing one which is widely reported. The excitingly titled Personal Consumption Expenditures Prices excluding Food and Energy Prices, or Core PCE for short, is the Fed’s go-to number when examining consumer price inflation because of the perception of it being less volatile than a measure including commodity-linked food and energy. Yes, yes, I know. Lies, damn lies and statistics. Food and energy prices ARE important because they are what people feel most. Nevertheless, the Fed in its, surely indisputable (steady: Ed) wisdom, likes Core PCE.
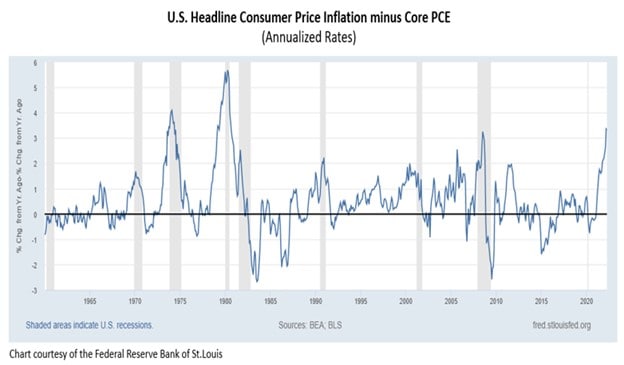
Headline consumer price inflation in the U.S. currently sits at an annualized rate of 8.6% whereas Core PCE is accelerating at 4.9%, a gap of 3.7%. The chart below shows the differential going back to 1960. The shaded areas indicate a U.S. economic recession.
On the three previous occasions when the gap has moved above 3%, an economic downturn has loomed. The gap reached over 4% in February 1974. There then followed a vicious bear market in stocks and an economic recession. In April 1980, the differential peaked at 5.7%, in the midst of a double-dip recession. And in July 2008, the gap between headline CPI and Core PCE peaked at 3.3%, just as the Global Financial Crisis was about to reach a dramatic crescendo.
Can we expect similar deflationary conclusions this time? That’s the way Elliott wave analysis is pointing.