Peak Inflation for U.S. Home Prices. Deflation Ahead?
It looks like the end of the cycle from 2009.
The latest S&P/Case-Shiller U.S. National Home Price Index data was released this week and it showed that home prices were rising at an annualized rate of 18.6% in June, down from a peak of 21.1% in April. The U.S. property market is coming under increasing strain as mortgage rates have surged this year. Reports of homes going unsold and sellers having to reduce asking prices are appearing every week. Is the market coming off the boil? Elliott wave analysis certainly points that way.
Back in the 1930s, R.N. Elliott discovered that the natural world, of which we humans are a part, tends to exhibit certain cyclical qualities. In terms of growth progression, he found that a five-wave advance tended to be followed by a period of regression. In terms of financial and asset markets, which are driven by human crowd behavior, he demonstrated this to be evident in nominal prices. But this five-wave impulse also has merit in terms of rate-of-change.
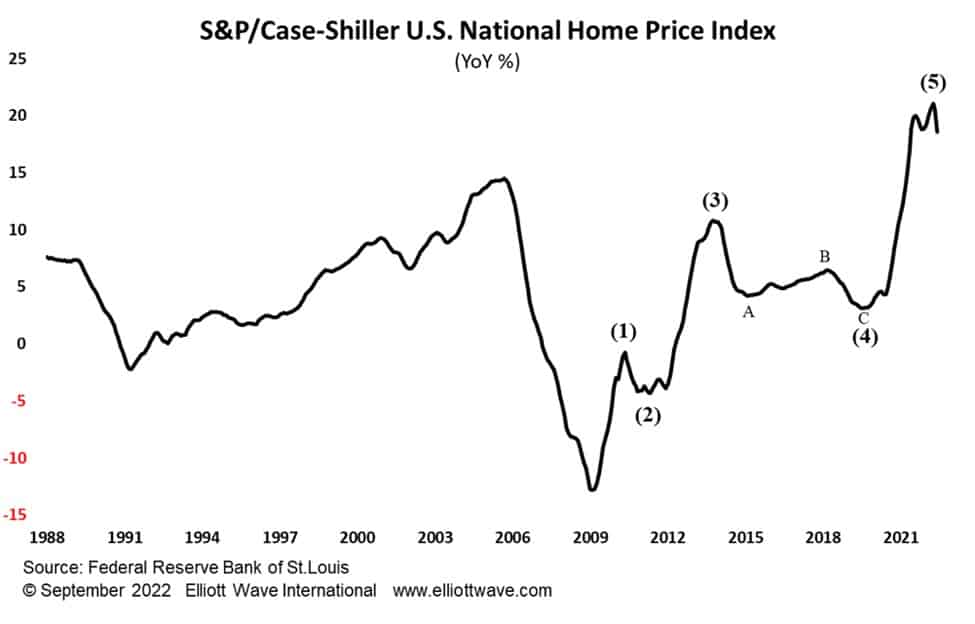
The chart below shows the annualized rate-of-change in the S&P/Case-Shiller U.S. National Home Price Index. From a low of minus 12% in 2009 the data sports a clear five-wave advance, fulfilling an Elliott wave guideline of wave (3) not being the shortest wave. Elliott wave aficionados will notice the clear three-wave, A-B-C, correction in wave (4), as well as five-wave subdivisions in waves (3) and (5).
If the Elliott wave model has any justification, which we of course think it does, this chart strongly suggests that U.S. home prices are starting a period of disinflation at the very least. Given the outlook for asset prices in general, we would not be surprised at all if U.S. property prices exhibits deflation in the future.