The Deflation Message from Money Velocity
The Quantitative Theory of Money hypothesizes that an increase in the money supply will increase prices on consumer goods and services, and vice versa. In that regard, the massive increase in money supply in developed economies since 2008 might be said to finally be coming through in accelerating consumer prices. However, given the time lag since money printing started over 13 years ago, the theory is patchy at best.
On a related angle, though, is the fact that such a period of elevated money printing cannot last forever (without societies disintegrating like Venezuela) and so at some point (which is perhaps now), central banks will have to stop the printing press and tighten monetary policy. With such a bubble in asset prices, driven by social mood and fueled by free money, the chance of bubble deflation is very high as social mood turns negative. That should result in debt deflation and, very probably, consumer price deflation.
The velocity of money is a statistic often used when thinking about deflation. This is from the Federal Reserve Bank of St. Louis referring to U.S. money velocity:
“Calculated as the ratio of quarterly nominal GDP (Gross Domestic Product) to the quarterly average of M2 money stock. The velocity of money is the frequency at which one unit of currency is used to purchase domestically-produced goods and services within a given time period. In other words, it is the number of times one dollar is spent to buy goods and services per unit of time. If the velocity of money is increasing, then more transactions are occurring between individuals in an economy. The frequency of currency exchange can be used to determine the velocity of a given component of the money supply, providing some insight into whether consumers and businesses are saving or spending their money.”
If money velocity is declining, theory has it, then less transactions are occurring between individuals in an economy, with the inference being that more saving relative to spending is going on. But given the calculation (Gross Domestic Product / money supply), it can also be thought of this way: If money velocity is declining, then it is taking more and more money to sustain a given or increasing level of GDP. In other words, nominal GDP could be artificially elevated from the inflated money.
The velocity of money was declining in the U.S. all through the roaring 1920s, a sign that perhaps GDP was being artificially inflated by an increasing amount of money relative to the size of the economy. We all know how that ended.
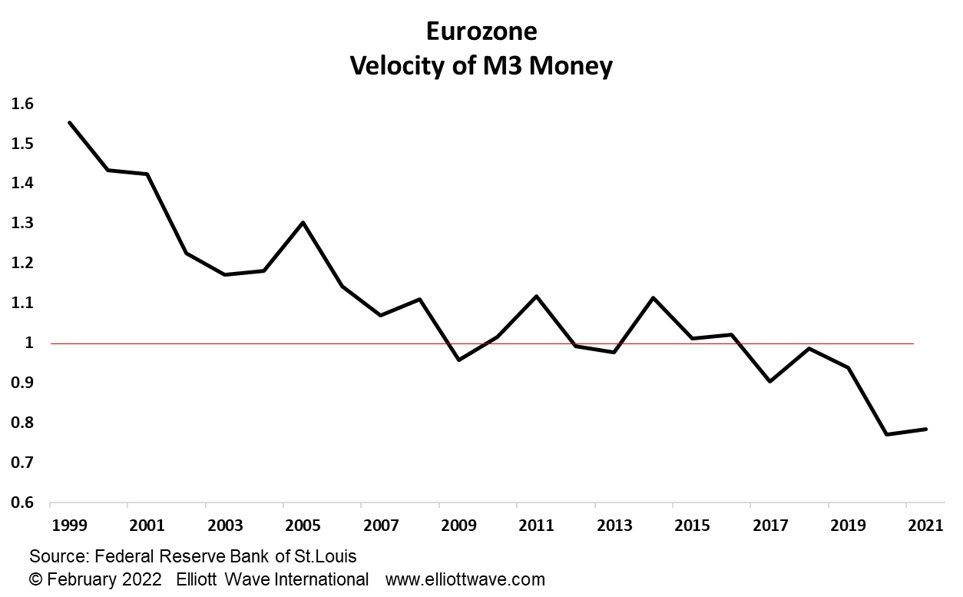
Fast forward to today. Money velocity in the U.S. has been declining since it peaked in the late 1990s. For the Eurozone, the chart below shows that money velocity has also been declining relentlessly since then, albeit with a respite between 2009 and 2016.
The message from velocity of money is clear. The level of GDP in developed economies is very probably being artificially elevated due to the gargantuan increase in money.
Like 1929, this should not end well.