The Fed’s Deflation
Does Quantitative Tightening mean anything for stock markets?
So, finally the Federal Reserve has confirmed that it is starting the process of Quantitative Tightening. Quantitative Easing involved creating trillions of dollars out of thin air and using them to purchase assets such as bonds. This resulted in a massive increase in the Fed’s balance sheet. In 2003, the Fed’s balance sheet stood at $720 billion and grew to $900 billion at the start of September 2008. Since September 2008, though, the Fed’s balance sheet has gone ballistic, with the current valuation an eye-watering $8.9 trillion!
During that time, of course, the U.S. stock market has enjoyed a spectacular bull market, with the S&P 500 index advancing by over 570% since the financial crisis low in 2009, a Fibonacci 13 years. Curiously, another bull market lasted for 13 years after another “shock,” of the stock market crash in 1987. In that bull run, the S&P 500 index advanced by 618% before a vicious bear market saw it decline by 50% in two years.
The question is whether Quantitative Easing (QE) has helped fuel the bull market in stocks since 2009. Although it is a positive social mood which is the true driver of a bull market in stocks, to non-socionomists, there seems to be a relationship between QE and the advance in the S&P 500. However, this is spurious. As Robert Prechter pointed out in the January 2011 edition of The Elliott Wave Theorist, the stock market continued to decline during the Fed’s first round of QE in 2008. As he stated at the time, “The Fed did not cause markets to do anything. Crashing markets pushed the Fed to react.”
Fast forward to 2022 and a similar thing is happening, only this time in reverse. Soaring markets, over the last few years, are pushing the Fed to react. As the trend in social mood appears to be peaking, the Fed feels confident enough to deflate its balance sheet and start Quantitative Tightening (QT).
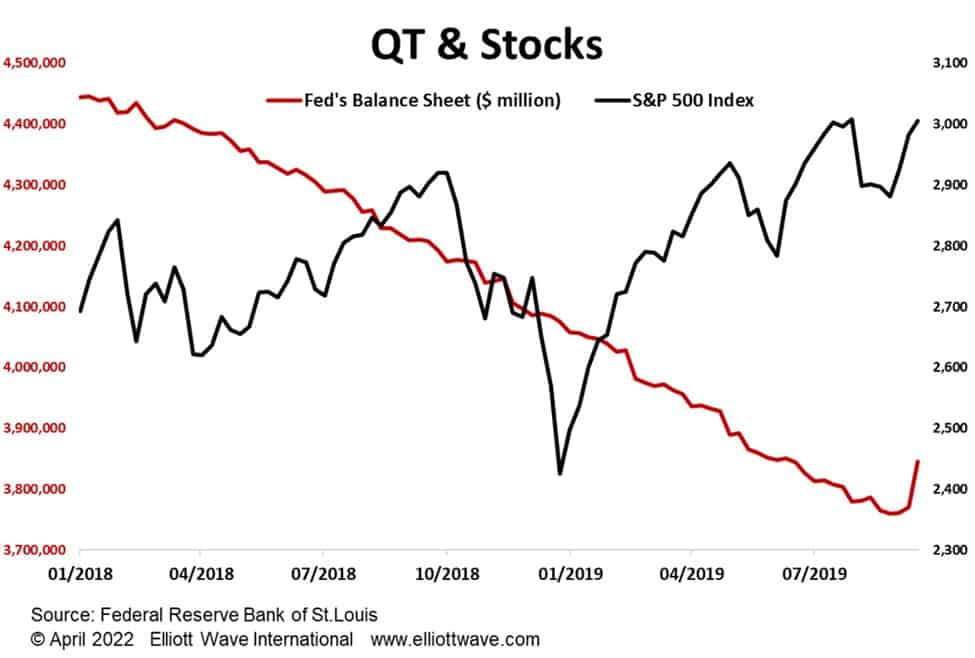
The last time the Fed attempted deflation in a meaningful way was in 2018 through to 2019. The chart below shows what happened with the stock market as that process was taking place. It had a couple wobbles but went sideways-to-up over the period. Can we say, therefore, that QT this time will be coincident with the same sort of price action in the stock market? Perhaps some people will be thinking that, but the real driver of the stock market remains the trend in social mood.
Given the Elliott wave outlook for U.S. stocks, that trend is set to become much more negative as this year progresses.