This Could Point to Deflation Next Year
Is it data mining, or could it have value?
“Nowhere does history indulge in repetitions so often or so uniformly as in Wall Street,” is a line in the peerless tome which is Reminiscences of a Stock Operator by Edwin LeFèvre, ostensibly a biography of, arguably, the greatest trader who ever lived, Jesse Livermore.
I first came across Livermore’s name when Paul Tudor Jones mentioned it in Jack Schwager’s Market Wizards book. Jones and Livermore both started in the cotton market and the influence of Reminiscences, and that quote above, seems strong because Jones, along with his then research director, Peter Borish, were (and no doubt still are) big fans of chart analogs.
Chart analogs compare a market’s price action over two different periods of time to discern similar patterns that may repeat. Because human herding behavior drives market price action, and human behavior repeats, the philosophy behind chart analogs is sound. Naturally, critics will highlight that the two periods being compared could differ in many ways based on so-called fundamentals, but they completely miss the point. It’s simply about repeating human behavior.
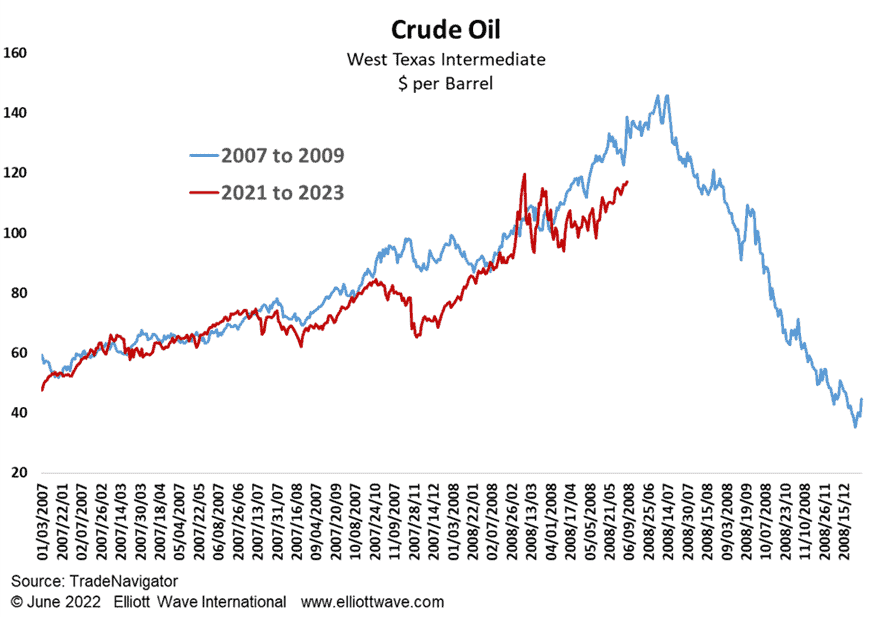
The chart below shows the price of Crude Oil from the start of 2007 to the end of 2009 (blue line) as well as the price from the start of 2021 (red line). The scale is the same and the price development seems uncannily similar. If this analog is to continue, we can anticipate that Crude Oil should top out around July and then proceed to decline markedly (ok, crash) into 2023. The Elliott wave structure suggests that the current rally is terminal and so, just maybe, this chart analog could be giving us a clue as to what to expect.