Inflation Falls as M2 Hints of Deflation
Inflation peaked at 9.1% in June and has been in a slide since (six months in a row).
Here’s the latest (Washington Examiner, Jan. 12):
Inflation drops to 6.5% in December as price pressures ease
In the meantime, deflationary forces continue to gather steam.
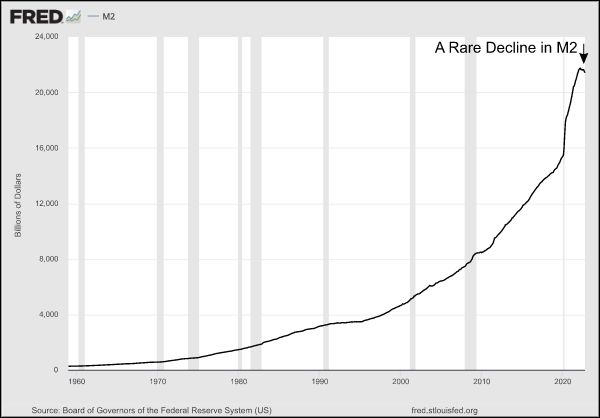
This chart and commentary are from the December Elliott Wave Theorist:

Quantitative tightening is rare, and it is happening. According to the St. Louis Fed, M2 is defined as follows:
“M2 is a measure of the U.S. money stock that includes M1 (currency and coins held by the non-bank public, checkable deposits, and travelers’ checks) plus savings deposits (including money market deposit accounts), small time deposits under $100,000, and shares in retail money market mutual funds.”
[The chart], published by the Fed, shows that absolute M2 has been declining on a month-by-month basis for the first time in many decades, probably since the 1930s or 1940s. This trend is deflationary. [emphasis added]
It is incredible that this trend has emerged. It took a historic, 13-year orgy of money-printing by the Fed from 2008 through 2021 to finance the final runup in the Great Asset Mania. There is no way it can be resuscitated under conditions of a flat M2, much less a shrinking M2.
