Is the Deflationary Threat Starting to Subside?
An economist recently argued that the forces which had kept inflation at bay in past years may be starting to fade.
In other words, the increased inflation in 2021 may be more than transitory.
Here’s an excerpt from a Sept. 20 Bloomberg article:
Right now, a lot of the inflation discussion is about fairly short-term factors. Chips. Used cars. Rent. And other categories that are feeling the impact of the pandemic. How long will these categories be on the move? At what point will these moves no longer be considered “transitory?” These are the debates people are having.
Of course, prior to the crisis, inflation had been mild for some time. In a note out on Monday, Michael Pearce of Capital Economics notes some of the disinflationary headwinds that had kept numbers low in recent decades.
Among them are:
• Ongoing technological process
• Globalization
• Weakening unions
• Central banks around the world committed to keeping inflation lowPearce argues that some, or all, of these trends may be poised to reverse going forward.
On the other hand, Elliott Wave International’s October Global Market Perspective says don’t dismiss the prospects for deflation. Here’s a chart and commentary:
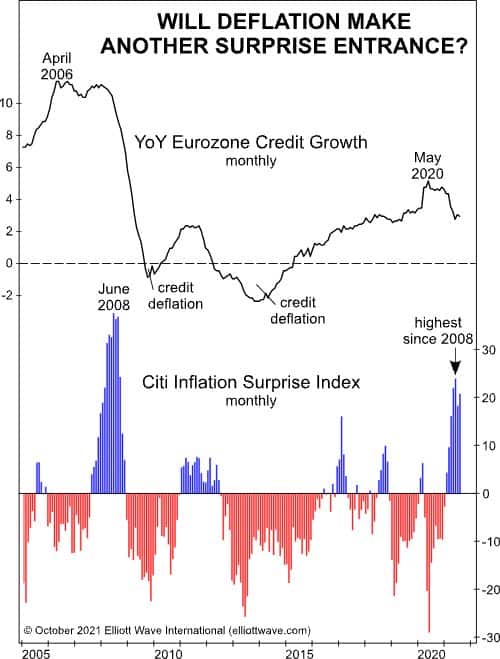
We remain skeptical that deflation is actually dead, and the top graph on this chart illustrates why. After expanding from 2015 to 2020, eurozone credit growth peaked in May 2020 at an annual rate of about 5% and has since fallen to about 3%. Our skepticism stems from the fact that a similar reversal happened ahead of the 2008-09 financial crisis. In April 2006, credit growth peaked at 11.4% and then plummeted. The metric dipped below zero in late 2009, precipitating the sovereign debt crises that later hit Portugal, Italy, Greece, and Spain. From 2012 through 2014, a broader stretch of credit deflation coincided with a series of banking crises that hit Cyprus. As EWI has long argued, the ebb and flow of credit liquidity is the essential financial metric that moves all markets. Since liquidity is receding again, watching the behavior of various markets will become even more important.
The period of time from 2006 to 2008 illustrates another theme that could be especially relevant today: Credit deflation entered the picture in direct opposition to economists’ expectations. The bottom graph illustrates the Citi Inflation Surprise Index, which measures how far consumer-price movements vary relative to economists’ expectations. The blue bars, for example, show above-zero readings, indicating that CPI inflation came in higher than expected. Red bars, in contrast, show below-zero readings and illustrate lower-than-expected inflation data. In 2008, inflation surprises lagged the downward trend in credit growth by 13 months, accelerating to the upside until June 2008. The index peaked that month but would not record downside surprises until November 2008. The pattern happened again in 2011. Credit growth peaked ahead of the Inflation Surprise Index and went on to record the most significant stretch of credit deflation in Europe’s modern financial era. From 2012 through 2015, inflation data continuously came in below expectations.
Will history repeat itself? As we noted above, credit growth peaked in May 2020, and the Inflation Surprise Index followed 11 months later. If the past is indeed prologue, inflation data should start to surprise to the downside, with outright credit deflation returning in less than a year.