U.S. Housing Market: “Worst Contraction Since 2006”
You probably recall the bursting of the U.S. housing bubble which occurred 16 years ago.
U.S. housing prices had topped in 2006 and that was followed by the subprime mortgage “meltdown” which shook the financial world to its core.
Here in 2022, there’s this headline (Markets Insider, June 10):
The US housing market is seeing its worst contraction since 2006 as mortgage applications crumble, says Freddie Mac economist
The Elliott Wave Financial Forecast pointed out reminders of the prior housing boom-and-bust back in April in a section titled “A True Fact: The Spirit of ’06 Is Thriving.”
Here’s a chart and commentary from that section:
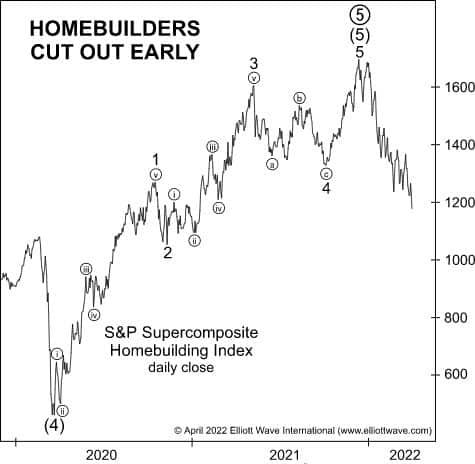
The latest housing mania carries a “last chance to get in” vibe that even the boom of the mid-2000s failed to muster. Many experts say the price gains of recent months are just a beginning. Zillow’s latest housing price forecast is for year-over-year home price growth to increase to 22% by May. A Facebook post from a local real estate broker highlights a CNN Business story that the broker first posted in 2021. The story, about a house that drew 76 all-cash offers, is headlined “The Housing Madness Shows No Sign of Slowing.” Says the bullish broker, “I warned you then. Is it slowing this year? All arrows point to no.” We disagree. In fact, many of the arrows that matter most are now pointing down. In addition to the … over-the top bullish sentiment, there is now a clear trend reversal in the S&P Supercomposite Homebuilding Index, shown above. In September 2005, the Elliott Wave Financial Forecast pointed to a similar reversal in the same index and stated that home prices would eventually follow. Prices peaked in August 2006.