U.S. Economy Still in a Technical Recession (or Worse)
Preliminary data showed that U.S. GDP shrank by 0,9% in Q2. However, that percentage figure has been revised.
Here’s an August 25 Fox Business headline:
GDP shrank at revised 0.6% rate in second quarter, signaling US remains in technical recession
A recession is officially defined as two consecutive quarters of negative GDP growth and in Q1, the economy shriveled by 1.6%.
Before the official Q2 GDP figure was released, the August Elliott Wave Theorist said:
I don’t think the economy is in a recession. I think it is in a depression. It will develop over the next three years.
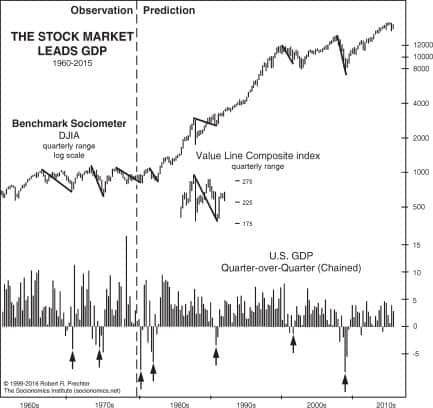
The economy usually lags downturns in stock prices by three to twelve months. September 1929 was one of the few times the economy turned down in tandem with stock prices. The year 2022 is probably on the same path.
A depression is not obvious in its first, second or even third quarter. It becomes obvious at the bottom. But the entire period of contraction is still a depression.
The earlier we can recognize a developing depression, the better we can prepare. Waiting until the bottom to tell people a depression is occurring doesn’t help anyone.
Further, Robert Prechter’s Last Chance to Conquer the Crash explains why depressions and deflationary crashes go together:
A deflationary crash is characterized in part by a persistent, sustained, deep, general decline in people’s desire and ability to lend and borrow. A depression is characterized in part by a persistent, sustained, deep, general decline in production. Since a decline in credit reduces new investment in economic activity, deflation supports depression. Since a decline in production reduces debtors’ means to repay and service debt, a depression supports deflation.