U.S. Auto Sales: Here’s What the Slowdown Portends

Car and truck commercials have been a mainstay on national and local television for decades.

So, you don’t have to be an economist to know that the automobile industry is a key part of the U.S. economy.

However, sales have declined in Q1 versus a year ago.

Here’s an April 1 U.S. News headline:

U.S. Auto Sales Fall in Q1 …

Indeed, General Motors reported on April 1 that its sales were down 20% for the quarter. Nissan’s sales tumbled 30% and Honda’s sales fell 23%. Toyota saw a 15% decline.

This is no surprise to Elliott Wave International.

Even before Q1 kicked off, the December 2021 Elliott Wave Financial Forecast showed this chart and said:

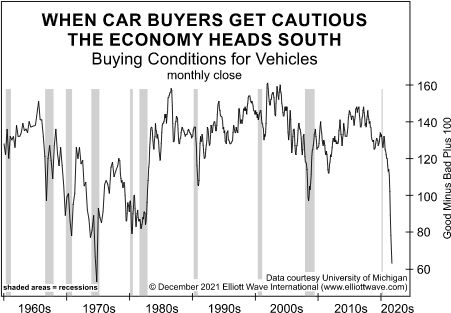
Demand for cars appears to be a thing of the past. This chart suggests consumers are souring on the whole idea. It shows buying conditions for vehicles from queries issued by the University of Michigan’s monthly consumer sentiment survey since the mid-1950s. Since the mid-1960s, a decline in consumers’ view of car buying conditions invariably preceded every economic contraction. The measure has never experienced a more dramatic plunge than in recent months. Economic headwinds are likely much closer than economists realize.

Housing Bubble “Slowly Deflating” in the “Land Down Under”

Housing prices have soared in many global hot spots, including Australia.

However, a reversal appears to be in the making, especially in two of the nation’s largest cities. Here’s an April 2 Reuters headline:

Australia housing bubble slowly deflating as heat leaves Sydney, Melbourne

Specifically, February to March, home prices fell 0.2% in Sydney and slipped 0.1% in Melbourne.

Another global market where there’s been a housing boom is the U.S.

Yet, at this juncture, the supply of housing has been rising. Elliott Wave International’s April Global Market Perspective provides a historical with this chart and commentary:

Housing booms always decrease housing inventories. As they reach exhaustion, supply creeps higher, which it is now doing, just as it did prior to the August 2006 peak. As the chart shows, at 6.3 months of supply, the ratio of houses for sale to houses sold is comparable to August 2006, when it was 6.9 months of supply. The record ratio of 12.2 came in January 2009. It should be exceeded before the next real estate price decline concludes.

So, it appears that the “deflation” of a housing bubble extends beyond Australia.

Has the Historic “Credit Boom” Reached a Peak?

You may be aware that some online retailers offer “buy now, pay later” loans (BNPL loans) for the financing of purchases.

These popular loans, especially short-term ones, have not been reported to credit bureaus. However, change is afoot.

Here’s the latest news (CNBC, March 20):

Transunion, Equifax and Experian have announced plans to include BNPL loans on credit reports.

Looking at the big “credit” picture, the Elliott wave model suggests that the historic “credit boom,” which has been in the making for decades, is either at or nearing a peak. The completion of five waves indicates the trend turn.

Here’s a chart and commentary from the March Elliott Wave Financial Forecast:

The chart suggests the economy is on shakier ground than economists suspect. Total U.S. consumer credit outstanding includes credit card debt, personal loans, auto loans, and student loans. It does not include mortgages, which is somewhat remarkable considering how closely its rise resembles that of home prices. Clearly, home prices and consumer credit levered the rising social mood of Cycle wave V extremely well. Since it sports the same look as home prices, however, consumer credit faces a similar reversal. As The Socionomic Theory of Finance explains, the form of the rise is five waves because “credit trends are socionomically regulated.” This means that in a bull market, as creditors and debtors “cooperate with each other, loans balloon to a high level. The ensuing, natural trend toward negative social mood, at whatever point it begins, induces pessimism, which motivate lenders to call in loans and participants in the economy to curtail expansionary activity.”

The Demand for Cash is Rising

One sign of a developing deflationary psychology is a rising demand for cash.

Look at this March 15 Yahoo! Finance headline:

Investors are beginning to hoard cash on recession fears: BofA

This is quite in contrast with the actions of money managers as recently as October 2021.

Then, the Elliott Wave Financial Forecast showed this chart and said:

When the 10-month average of the U.S. mutual fund cash-to-assets ratio fell to 4.6% in March 2000, EWFF cited the “utter contempt for cash” as a clear sell signal and forecasted a quick shift when “Cash is king.” As the chart shows, the S&P 500 declined 51% over the next 31 months. … When it comes to cash, the ultimate safety net, investors have never been stretched as thin as they are now. At 2.02 %, for instance, the 10-month average of cash-to-assets held by mutual fund managers is—incredibly—less than half of what it was at the end of the dot.com mania in 2000. The third graph on this chart shows the Investment Company Institute’s ratio of cash in money market funds as a percentage of S&P market capitalization (the Retail Money Market Ratio). The latest reading of 2% is the lowest in the 41-year history of the data. According to Rydex’s mutual fund data, a historic disdain for cash continued through much of September. … Back in January 2020, when the Rydex money market holdings dropped to 0.10% ten times in one month, EWFF stated, “The bullish imperative is the most persistent yet.” The next big move for the S&P 500 was a 35% decline to March 23, 2020. The current situation is even more extreme.

The bottom graph shows another unprecedented exposure to equities. The Net Cash Available to Invest figure subtracts liabilities or margin debt held by investors at New York Stock Exchange member firms from free credits, which are essentially the same as cash. The biggest net deficits generally come at stock market highs. The latest figure for August is -$493.3 billion, a record. The deficit is more than 3.7 times that which occurred at the March 2000 peak.

Just three months later, the S&P 500 hit an all-time high on Jan. 4, 2022.

Also, keep in mind that the value of cash rises during deflation. So, getting back to that March 15 Yahoo! Finance headline, those investors hoarding cash are likely taking a wise step in preparation for the future.

This Precondition for Deflation is Met

On March 10, the Federal Reserve reported that U.S. household net worth surpassed $150 trillion for the first time in Q4 of 2021.

This is not surprising considering the substantial rise in stock portfolios and real estate values last year.

However, there’s a flip side. Debt also rose rapidly – not only for households, but for businesses and government too. This is from CNBC (March 10):

Total nonfinancial debt came to $65.1 trillion, including $17.9 trillion at the household level, $18.5 trillion in the business world and $28.6 trillion from government. Each category saw substantial rises.

Household debt jumped at an 8% annual rate, owing to a 6.9% rise in consumer credit and an 8% jump in mortgages. Nonfinancial business debt increased at a 6.7% clip, while federal government debt leaped by 10.8% after declining 1.3% in the third quarter.

It appears that a major condition for deflation has been met.

This is from Robert Prechter’s 2021 Last Chance to Conquer the Crash:

Deflation requires a precondition: a major societal buildup in the extension of credit and the simultaneous assumption of debt. … Bank credit and Elliott wave expert Hamilton Bolton, in a February 11, 1957 personal letter to Charles Collins, summarized his observations this way:

“In reading a history of major depressions in the U.S. from 1830 on, I was impressed with the following:

(a) All were set off by a deflation of excess credit. This was the one factor in common.

(b) Sometimes the excess-of-credit situation seemed to last years before the bubble broke.

(c) Some outside event, such as a major failure, brought the thing to a head, but the signs were visible many months, and in some cases years, in advance.

(d) None was ever quite like the last, so that the public was always fooled thereby.

(e) Some panics occurred under great government surpluses of revenue (1837, for instance) and some under great government deficits.

(f) Credit is credit, whether non-self-liquidating or self-liquidating.

(g) Deflation of non-self-liquidating credit usually produces the greater slumps.”

Self-liquidating credit is a loan that is paid back, with interest, in a moderately short time, from production. … Non-self-liquidating credit is a loan that is not tied to production and tends to stay in the system (purchases of cars, boats or homes, or for speculations such as purchases of stock certificates and financial derivatives).

Japan’s Prime Minister Wants Next BOJ Head to Focus on Beating Deflation

Japan’s repeated efforts to defeat deflation has been going on for roughly three decades.

And, now, Japanese Prime Minister Fumio Kishida is looking ahead to April 2023 – when the current Bank of Japan Governor Haruhiko Kuroda’s term ends.

Here’s a quote from a March 4 Reuters article:

Japan’s next central bank governor should be someone who understands the need to work with the government in beating deflation, Prime Minister Fumio Kishida said on [March 4].

So far, Japan has fallen short of reaching its 2% inflation target despite the central bank’s stimulus efforts. 

Robert Prechter’s 2021 book, Last Chance to Conquer the Crash, provided this perspective:

Japan had one of the strongest economies in the entire world, growing at a 9% rate for 20 years up to 1973, and then a pretty strong rate of about 4.5% through 1994. From there, it’s averaged about 1%.

The reason Japan is in trouble was expressed in a November 1, 2012 headline from MarketWatch: “Japan Is in Worse Than a Deflationary Trap.” But it’s not worse than a deflationary trap. It’s just a deflationary trap. Here’s what the article says: “Policy makers have spectacularly failed. Brutal deflation persists. Japanese officials tried monetary stimulus, including zero interest rates and quantitative easing.” Does that sound familiar? And here: “Past fiscal stimulus has ballooned the national debt to 200% of GDP.” Does that sound familiar, too? And finally, “The most troubling aspect of Japan’s malaise may be psychological.” That’s the key to the whole thing. When social mood changes psychology from ebullience to conservatism, a trend of expanding credit shifts to a trend of declining credit and therefore inflation into deflation.

Sir Paul McCartney’s Penthouse and Price Deflation

Beatles’ fans are familiar with Paul McCartney’s song “She’s Leaving Home,” which is on the Sgt. Pepper’s Lonely Hearts Club Band album.

Well, as Sir Paul was leaving home, at least one of them, he took a hefty loss (WSJ, Feb. 17):

Famed ex-Beatle Paul McCartney and his wife, Nancy Shevell, have sold their penthouse on New York’s Fifth Avenue for about $8.5 million, roughly 45% less than what they paid for it in 2015, according to a person familiar with the situation.

The famous couple bought the co-op apartment for $15.5 million.

As you no doubt know, housing market prices have sharply risen with record speed in recent years.

If the stock market continues to trend lower, expect even steeper price deflation in some locales, especially where housing prices have reached exceptionally high levels (think back to Las Vegas and parts of Florida during the prior housing bust).

You see, real estate prices and stock market prices tend to trend together.

Here’s a chart and commentary from Robert Prechter’s 2021 Last Chance to Conquer the Crash:

Real estate prices have always fallen hard when stock prices have fallen hard. The chart displays this reliable relationship.

Is Price Deflation Just Ahead for the U.S. Housing Market?

By some metrics, the U.S. housing-market boom of recent years has been more extreme than even the one that peaked in 2006.

For example, the speed with which housing prices have risen has never occurred before.

Yet, there may be trouble on the horizon (Marketwatch, Feb. 17):

‘The housing market is set for a sustained softening’: New-home construction falters, even as builders secure more permits

If the housing market winds up crashing again, many financial institutions will find themselves in a dilemma.

Here’s a quote from the March Elliott Wave Theorist:

Some states in the U.S. have made it illegal for a bank to seize the home of someone who has declared bankruptcy. In such situations, the bank and its depositors are on the hook indefinitely for borrowers’ unthrift. Other states have made it illegal for a bank attempting to recover the value of a loan to seize any of a defaulting mortgage holder’s assets other than the mortgaged property. In such situations, the bank assumes the price risk in the real estate market. These states’ banks are vulnerable to severe losses in their mortgage portfolios and are at great risk of failure. …. Although many banks today appear to be well capitalized, that condition is mostly thanks to the great asset mania, which is ending. Much of the credit that banks have extended, such as that lent for productive enterprise or directly to strong governments, is relatively safe. Much of what has been lent to weak governments, real estate developers, government-sponsored enterprises, stock market speculators, venture capitalists, cryptocurrency investors, consumers, and so on, is not. One expert advised, “The larger, more diversified banks at this point are the safer place to be.” That assertion will surely be severely tested in the coming depression. In my view, local, conservatively run banks — a few of which exist — will prove to be safer.

China Attempts Controlled Deflation of Property Bubble

How big is China’s real estate bubble?

Here’s a comparative measure to give you a fair idea: In New York City and London, home prices are roughly 10x the average annual income. In Beijing and Shanghai, home prices are about 30x what residents earn in a year.

Hence, Chinese authorities are attempting to deflate prices without hurting the economy – a “gentle” deflation. One major push has been to restrict the leverage of property developers.

A Feb. 7 Bloomberg headline sums it up:

China’s Taking on a Risky Bubble Deflation Experiment

However, back in December, Elliott Wave International’s monthly Global Market Perspective said that a methodical and controlled deflation is not in the cards:

According to various summaries of China’s real estate “reckoning,” the Chinese property market is a “House of Cards.” After comparing the situation to peer-to-peer lending programs that “operated like giant Ponzi schemes,” one article concludes, however, that the “bursting of the bubble likely won’t trigger a crisis similar in scale to the American recession of 2008.” We agree: It won’t. The scale of the unfolding peak is much larger, so the crisis will be much larger as well. Despite the recent deterioration in China’s real estate market, belief in the Chinese government’s capacity to manage the crisis continues to run high. This is true even as it turns further away from capitalism and further toward communism. As the Global Market Perspective noted in October, China’s government recently revealed its willingness to micromanage every aspect of the economy in the name of “Common Prosperity.” The slogan comes directly from the original communist party chairman Mao Zedong, who introduced it in 1953. It didn’t work out so well the first time as China saw no material growth in GDP from 1958 to 1975. The irony of its reintroduction should prove even more profound this time.

Consumers Adopt a Cautious Mindset

A developing deflationary psychology is evidenced by an overall shift from an expansionary mindset to one of conservation.

This applies to creditors, debtors, producers and consumers.

Honing in on consumers specifically, that means a cutback in spending.

With that in mind, here’s a Feb. 4 headline (CNN Business):

PayPal warns that consumer spending is about to fall sharply

The monthly Elliott Wave Financial Forecast gave a heads-up about consumer spending back in November:

Consumer spending increased just 1.6% in the third quarter after rising 12% in the second quarter. But as we’ve long said, the economy lags the market. With stock indexes at new highs, many measures of economic activity will remain elevated until a bear market is underway.

Now that a downtrend in aggregate stock prices appears to be underway, expect “many measures of economic activity” to ratchet downward in the months ahead.

In a severe bear market, like what occurred in the early 1930s, declines in economic activity can be dramatic. From 1929 to 1933, GDP fell by 45.6%.

In the throes of the 2007-2009 bear market, the November 2008 Elliott Wave Financial Forecast said:

In September [2008], we showed a picture of consumer confidence and said a previously “forecasted plunge is clearly underway.” And plunge it did. This month’s Conference Board figure fell to 31, the lowest reading in the 41-year history of the index. … On the manufacturing side, Industrial Production plunged 2.8% in September, the biggest one-month decline since December 1974, the final month of the last bear market of at least Cycle degree. What about the global economic engine that was supposed to compensate for U.S. shortcomings just a few short months ago? The Baltic Dry Index is another index that expresses the global scope of the downturn. It measures the demand for shipping capacity through dry bulk shipping rates. It is down more than 90%—since May 23, only five months ago!

Join the Deflation.com Email Newsletter

Subscribe Now