Slow U.S. Car Sales Ominous for Economy

Many U.S. motorists are saying: “The car I have now will do just fine.”

Indeed, these motorists are keeping their cars longer than ever. S&P Global Mobility recently stated that the average U.S. vehicle hitting the highways is 12 years and 2 months old. That’s the highest number in the more than 20 years the data has been tracked. 

Related, a June 14 Fox Business sub-headline says:

Total US vehicle sales projected for 13.1 million transactions in 2022, falling below 17 million average

As you might imagine, this does not bode well for the economy.

The monthly Elliott Wave Financial Forecast has been ahead of both developing stories – the U.S. car market and the economy.

Here’s a chart and commentary from the December 2021 issue:

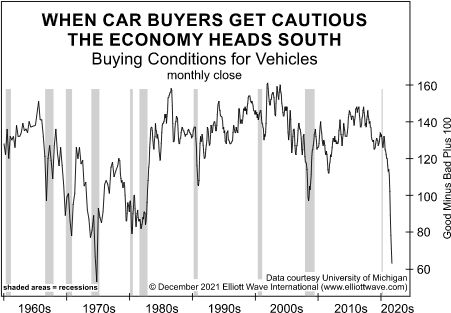
The chart … shows buying conditions for vehicles from queries issued by the University of Michigan’s monthly consumer sentiment survey since the mid-1950s. Since the mid-1960s, a decline in consumers’ view of car buying conditions invariably preceded every economic contraction. The measure has never experienced a more dramatic plunge than in recent months. Economic headwinds are likely much closer than economists realize.

This warning about the economy was prescient. U.S. GDP contracted by 1.5% in Q1 2022.

U.S. Housing Market: “Worst Contraction Since 2006”

You probably recall the bursting of the U.S. housing bubble which occurred 16 years ago.

U.S. housing prices had topped in 2006 and that was followed by the subprime mortgage “meltdown” which shook the financial world to its core.

Here in 2022, there’s this headline (Markets Insider, June 10):

The US housing market is seeing its worst contraction since 2006 as mortgage applications crumble, says Freddie Mac economist

The Elliott Wave Financial Forecast pointed out reminders of the prior housing boom-and-bust back in April in a section titled “A True Fact: The Spirit of ’06 Is Thriving.”

Here’s a chart and commentary from that section:

The latest housing mania carries a “last chance to get in” vibe that even the boom of the mid-2000s failed to muster. Many experts say the price gains of recent months are just a beginning. Zillow’s latest housing price forecast is for year-over-year home price growth to increase to 22% by May. A Facebook post from a local real estate broker highlights a CNN Business story that the broker first posted in 2021. The story, about a house that drew 76 all-cash offers, is headlined “The Housing Madness Shows No Sign of Slowing.” Says the bullish broker, “I warned you then. Is it slowing this year? All arrows point to no.” We disagree. In fact, many of the arrows that matter most are now pointing down. In addition to the … over-the top bullish sentiment, there is now a clear trend reversal in the S&P Supercomposite Homebuilding Index, shown above. In September 2005, the Elliott Wave Financial Forecast pointed to a similar reversal in the same index and stated that home prices would eventually follow. Prices peaked in August 2006.

Government Spending and Debt Suggest “Calamity” Ahead

In October, the Dow Industrials were still climbing (the senior index later hit a high in January).

That same month (October), Robert Prechter mentioned several indications of an elevated social mood in his Elliott Wave Theorist, including this:

Governments feel rich and are spending like drunken sailors …

All that spending has racked up a lot of debt. And, as noted before in these pages, all major deflationary episodes have been preceded by unsustainable levels of debt.

With that in mind, on May 26, the Committee for a Responsible Federal Budget (a nonpartisan group) said that the federal debt is likely to reach 125% of gross domestic product in the next 10 years unless there’s a dramatic course correction.

On May 31, a Washington Examiner headline addressed the mounting federal debt:

New budget numbers show US careening toward calamity

And a “calamity” may be the only thing which will force governments to curtail spending in any meaningful way.

As Robert Prechter’s must-read Last Chance to Conquer the Crash says:

Cutting government spending is a good thing, but politics will prevent its happening prior to a crisis.

That crisis will likely be accompanied by a big bear market in stocks.

Think about the 2007-2009 bear market. The financial crisis which unfolded in conjunction with that stock market downturn was the worst since the Great Depression.

Indeed, the Great Depression followed the downturn in stocks which began in 1929.

Be aware that here in 2022, the Elliott wave model suggests that the next bear market may rival that of 1929-1932.

Let’s conclude with this quote from the May 2022 Elliott Wave Theorist:

There has never been a Grand Supercycle-degree top in U.S. stocks, because the last peak of that degree occurred in 1720, when there were no American stocks. Only the record of British stock prices reveals it. So, recent issues of EWT have looked to the Supercycle-degree top of 1929 for guidance on how a Grand Supercycle top might form.

Major Headwinds for China’s Economy

In a teleconference on May 26, Premier Li Keqiang of China implored local government officials to do all they can to shore up China’s economy.

Here’s a May 26 Washington Post headline:

‘No time to lose’: Top Chinese official sounds alarm over economy

Li mentioned the coronavirus and the war in Ukraine as just two factors which pose challenges to the world’s second largest economy.

The June Elliott Wave Financial Forecast also discusses China’s housing market. Here’s a chart and commentary:

On May 20, news headlines marked another “role reversal” of historic proportions. For the first time since 1976, China’s economic growth is expected to be less than that of the United States. This is not a positive development. China’s rise to become the world’s second biggest economy is a consequence of the Great Bull Market, and its recent retreat is one of the more prominent expressions of the emerging bear market’s progress. This is why the Elliott Wave Financial Forecast has paid such close attention to the Chinese property market. As the chart shows, month-to-month prices of China’s new-home sales turned negative in September, and they’ve continued to fall since. The year-over-year average of new home prices also fell in April. It was the first such decline since November 2015. The declines “have shaken a core belief among many in China that buying a home is a surefire investment.” Of course, these are official government figures, so they are subject to the machinations of the Chinese Communist Party. The sales at Chinese property developers tend to be a more reliable indicator of the real estate market’s true health. According to The Wall Street Journal, year-over-year sales by China’s top 100 developers turned negative in July 2021, falling 8.3%. Since then, the decline increased every month, reaching 58.6% in April. The volume of land sales by cities is another dependable Chinese property market indicator. In the first three months of the year, land sales in 300 Chinese cities fell 60% from the first quarter of 2021.

The weakness is now spreading throughout China’s economy, as April 2022 industrial production declined 2.9% compared to April 2021. Retail sales fell 11.1%, and car purchases declined 35.5%.

The Property Insurance Market in the “Sunshine State” Looks Cloudy

Insurance against unexpected misfortune is a must.

But what if the insurance company itself is in trouble? That’s the dilemma which many Florida property owners face.

Here’s an NBC News headline from May 21:

Roofing scams put Florida’s property insurance market ‘on the verge of collapse’

The failure of insurance companies was addressed in Robert Prechter’s must-read, Last Chance to Conquer the Crash:

In a crash and depression, we will see falling asset values, massive layoffs, high unemployment, corporate and municipal bankruptcies, pension fund implosions, bank and insurance company failures and ultimately social and political crises. The average person, who has no inkling of the risks in the financial system, will be shocked that such things could happen, despite the fact that they have happened repeatedly throughout history. [emphasis added]

One way to prepare for a major financial crisis is to investigate insurance firms (as well as other financial institutions such as banks) for soundness and safety.

Let’s return to Last Chance to Conquer the Crash:

As far as I can tell, Weiss Ratings, Inc. has produced reasonably reliable ratings of U.S. insurance companies. Their system is simple and straightforward. Unlike the maze of gradations such as “Bbb+” and so on that other services use, the Weiss system simply reads like a report card, from A+ down to F, adding only a set of “E” grades prior to F. Weiss considers any company rated B- or above to have “good” financial safety but recommends that you do business with companies rated B+ or better. In normal times, that assessment is probably all you need. If you believe, however, that there is a reasonable risk of that rare and devastating event, a deflationary crash and depression, why not demand the absolute best?

As prudent as the judgments of a rating service may be, any such ratings do not fully take into account other considerations that will be crucial in a depression. For example, what bank(s) does your insurer use to hold its assets and make transactions? If an insurer’s main bank implodes, its situation could become chaotic. This one factor could override an insurer’s A+ credit rating. Ratings can change for all sorts of reasons. For maximum confidence, keep abreast of ratings as they pertain to the companies you choose, but do your own research as well.

Why the Setup is Ripe for Deflation

History shows that each major deflationary episode was preceded by “a major societal buildup in the extension of credit and the simultaneous assumption of debt,” as Robert Prechter’s must-read Last Chance to Conquer the Crash notes.

With that in mind, review this May 10 CNBC news item:

Even with rampant inflation and rapidly accelerating interest rates, household borrowing climbed to start 2022 and hit a new record. …

Consumer debt and credit rose 1.7% in the first quarter to $15.84 trillion. [emphasis added]

So, the setup is ripe for a historic credit contraction, i.e., deflation.

Around the time of the January tops in the Dow Industrials and S&P 500 index, the January Elliott Wave Theorist warned about record debt and a host of other factors which indicated a historic financial optimism that was set to reverse:

A stock market peak of Grand Supercycle degree hasn’t occurred for 302 years. Completed wave patterns, throw-overs of multi-year channels, euphoria among investors, confidence among consumers and economists, an expanding economy, low unemployment figures, record debt and a record-low quality of debt all indicate a historic positive extreme in social mood, greater than those of 1720, 1835, 1929, 1937, 1966-1968, 1999-2000 and 2007. The stock market is spectacularly overvalued. Stock ownership is the broadest in the history of humanity, both in the U.S. and abroad. Research is derided, while passive investing is lauded as the road to riches: Just buy funds comprising indexes and ignore the relative health of component companies. A hundred years ago there were only two stock indexes, one for every 1000 stocks. Now there are 70,000 indexes for every 1000 stocks. In 2009, there was one cryptocoin. Now there are thousands of them, mostly just clones of the original. Finance has intoxicated the public. The number of types of vehicles with which to speculate is unprecedented. The number of derivatives is unprecedented, and the aggregate value of those derivatives is unprecedented. The complexity of the investment marketplace is unprecedented. The number of investment manias in the past quarter century is unprecedented. Credit spreads are the lowest in history, and in some cases negative. European junk bonds recently had lower yields than U.S. Treasuries. Similar conditions have appeared in a few rare instances in history and — although past episodes have been far smaller in scope than at present — they have always led to a substantial crisis in the financial system.

Worker Productivity Substantially “Deflates” in Q1

U.S. nonfarm productivity is a measure of output against hours worked and it took a historic tumble in the first three months of the year.

This May 5 CNBC headline sums it up:

Worker output fell 7.5% in the first quarter, the biggest decline since 1947

This “deflation” in worker productivity ties in with what Robert Prechter wrote in his book, Last Chance to Conquer the Crash:

Economic contractions used to come in different sizes. Economists specified only two, which they labeled “recession” and “depression.” In 2009, they added a new term to the lexicon: “great recession.”

Based on how economists have applied these labels in the past, we may conclude that a recession is a moderate decline in total production lasting from a few months to two years. A depression is a decline in total production that is too deep or prolonged to be labeled merely a recession. As you can see, these terms are quantitative yet imprecise. They cannot be made precise, either, despite misguided attempts to do so. [emphasis added]

For the purposes of this book, all you need to know is that the degree of the economic contraction that I anticipate is too large to be labeled a “recession” such as our economy has experienced thirteen times since 1933.

Also keep in mind that U.S. GDP fell 1.4% in Q1. This should not be a surprise given the Dow Industrials and S&P 500 index topped in January.

Another quote (and chart) from Last Chance to Conquer the Crash provide insight:

If you study [the chart], you will see that the largest stock-market collapses appear not after lengthy periods of market deterioration indicating a slow process of long-term change but quite suddenly after long periods of rising stock prices and economic expansion. A depression begins, then, with the seemingly unpredictable reversal of a persistently, indeed often rapidly, rising stock market. The abrupt change from increasing optimism to increasing pessimism initiates the economic contraction.

Why the 1.4% Decline in GDP Should Be No Surprise

An April 28 CNBC headline says:

U.S. GDP fell at a 1.4% pace to start the year as pandemic recovery takes a hit

This annualized drop in GDP in Q1 is a surprise to some professional observers of the economy.

That CNBC article goes on to note that the negative GDP figure is “below analyst expectations of a 1% gain.”

However, analysts at Elliott Wave International are not surprised.

The reason why is that the broad U.S. stock market has already topped (for example, the Dow Industrials peaked in early January).

This chart and commentary from Robert Prechter’s landmark book, The Socionomic Theory of Finance, provide insight:

The stock market leads GDP. As the stock market fell in Q1 1980 and again in 1981-1982, back-to-back recessions developed. As the stock market rose from 1982 to 1987, an economic boom occurred. After stock prices went sideways to down from 1987 to 1990, a recession developed. As stock prices resumed rising, the economy resumed expanding. As the stock market fell in 2000-2001, a recession developed. As the stock market recovered in 2002-2007, an economic expansion occurred. As the stock market fell in 2007-2009, a recession developed, and it was commensurate with the size of the drop: The largest stock market decline since 1929-1932 led to the deepest recession since 1929-1933. As the stock market has recovered since 2009, an economic expansion has developed. In all cases but one, the stock market either turned down before the recession began or turned up before the expansion began. The lone exception was in 2002, when the Dow made a new low after the official end of the recession in 2001. Data show that a setback in GDP growth into that later bottom just barely missed creating a recessionary quarter. (It is important to understand that socionomic causality does not predict that each stock market decline will produce an official recession as defined by the NBER; it predicts that stock market declines and advances will reliably lead rather than follow whatever official recessions and recoveries do occur.

Homebuilder Sentiment Continues to Slide

The people who construct U.S. homes for a living are feeling increasingly pessimistic about their industry.

As this April 18 CNBC headline says:

Homebuilder sentiment drops for fourth straight month, as rising rates push housing to ‘an inflection point’

Of course, this pessimism is in stark contrast to the recent housing boom, which came with stories of people so eager to buy a home that they would forgo a walk-through to do so.

The price chart of a key index also reflects increasing pessimism.

This is from the April Elliott Wave Financial Forecast:

There is now a clear trend reversal in the S&P Supercomposite Homebuilding Index, shown above. In September 2005, the Elliott Wave Financial Forecast pointed to a similar reversal in the same index and stated that home prices would eventually follow. Prices peaked in August 2006.

After that August 2006 peak, U.S. home prices trended lower for more than five years.

The “deflation” of housing prices this go-round may last longer – and extend more deeply – given home prices rose even more rapidly than they did during the prior housing boom.

Major Bank Warns of Economic “Shock”

Get ready for a recession.

At least, that’s the message from one of the nation’s largest financial institutions.

Here’s an April 11 headline from Fox Business:

A ‘recession shock’ is coming to the US, Bank of America says

The article goes on to say that economists at Bank of America expect an economic downturn to result from the Fed’s gung-ho stance (raising rates) to get inflation under control.

Yet, Elliott Wave International has shown time and again that the market leads on rates and the Fed follows. More than that, Elliott Wave International anticipated higher rates well before these latest worries about a hawkish Fed.

As far back as Sept. 23, 2020, The Elliott Wave Theorist showed this compelling chart and said:

[The chart] depicts a 78-year history of the interest rate on the U.S. government’s 10-year notes. The 39 years of rising interest rates from 1942 to 1981 preceded 39 years of falling rates from 1981 to 2020. In some areas of the world in recent years, interest rates went negative, for the first time in history and maybe the last time in history—or at least a few centuries. Interest rates likely bottomed in March, which means bond prices have begun a significant fall. The change will occur most dramatically on lower-quality debt, but it will eventually spread to higher-quality debt such as depicted here.

Indeed, U.S. government bond prices have been trending lower (with yields surging higher) since this issue of the Theorist published.

As you probably know, bond prices and yields move inversely to each other.

Join the Deflation.com Email Newsletter

Subscribe Now