A study of past deflationary episodes reveals that all were set off by unsustainable debt levels.
With that in mind, look at this Nov. 9 CNBC headline:
Household debt total passes $15 trillion for the first time
Corporate debt has also been climbing.
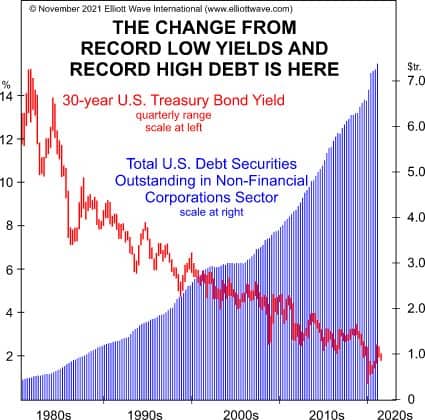
Here’s a chart and commentary from the November Elliott Wave Financial Forecast:
The chart shows that a 39-year bull market in U.S. Treasury long bonds that led to a record-low yield of 0.7% on March 9, 2020 coincided with a historic rise in total corporate debt levels. The optimism that generated the bull market in bonds also permitted companies to gorge on debt, with their confidence remaining sky high that the availability of cheap credit will continue and the cost to service it will remain low. The trend in yields, however, reversed in March 2020. …
A bear market in stocks will eventually suction away financial liquidity, at which point bond defaults should soar.
Germany’s economy is Europe’s largest and it’s losing momentum.
Here’s an Oct. 29 Marketwatch headline:
German Economy Grew at Slower-Than-Expected Pace in 3Q
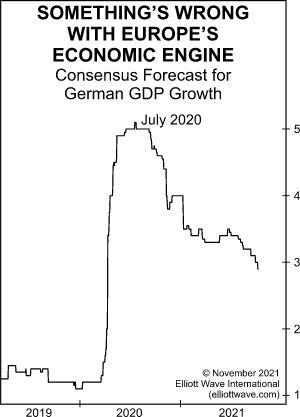
Elliott Wave International’s November Global Market Perspective showed this chart and said:
European new car sales fell to 718,598 last month, a 23% month-over-month decline and the lowest level for September since 1995. More important, strong declines were felt in all four of Europe’s biggest car markets: France, Germany, Italy and Spain. Moreover, the German housing boom suddenly hit a wall this autumn. The Europace Real Estate Index fell 0.2% in September, recording its second consecutive monthly decline and dropping the most since April 2020. In fact, Germany’s entire economic expansion appears to be faltering. According to the country’s five leading research institutes, the consensus GDP forecast now calls for 2.4% growth in 2021, down from a forecast of 3.7% this past April.
During the 2007-2009 subprime mortgage meltdown, the global financial system faced the fear of what was termed a “financial Armageddon.”
Big financial institutions like Lehman Brothers, Bear Stearns, AIG, Washington Mutual and others collapsed.
Here in 2021, consider this Bloomberg headline from September:
JPMorgan Stakes Its Own Capital on Record European Junk Bond Bet
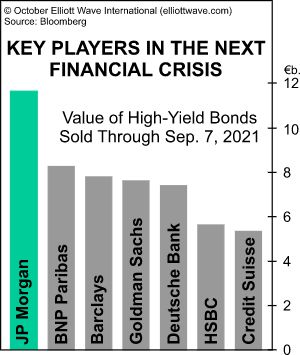
Elliott Wave International’s monthly Global Market Perspective provided a warning by showing this chart and saying:
At this point, the world’s largest investment banks have joined bondholders on the financial precipice. The chart at right illustrates the value of high-yield bonds sold by the largest investment banks from January 1 through September 7. According to Bloomberg, JP Morgan has never before in history committed as much of its balance sheet to European junk bonds. Through early September, the U.S. investment bank had underwritten a record 43 deals, “upping the ante even as strategists … warn that euro credit markets have become over-priced.” (Bloomberg, 9/7/21) Meanwhile, the bank’s bridge loan book (short-term loans that span financing gaps during takeovers) has pushed to its highest level since the 2008 financial crisis.
These dangers, too, are difficult to fully appreciate. When banks underwrite loans, they essentially promise investors an agreed-upon rate of interest. Then they eat any losses that arise when bond auctions fail to go as planned. The dynamic with bridge loans is even more dangerous, as investment banks lend money to the acquiring company under the assumption that they will get repaid with cash from the acquired company. Both of these assumptions will get tested mightily in the years ahead.
Consumer spending comprises 69% of the $23.2 trillion U.S. economy.
So, it’s not surprising to see a deceleration in U.S. economic growth when consumers significantly cut back on spending.
And, in Q3, that’s what happened.
Here’s an excerpt from an Oct. 28 CNBC article:
The U.S. economy grew at a 2% rate in the third quarter, its slowest gain of the pandemic-era recovery … the Commerce Department reported Thursday.
Gross domestic product, a sum of all the goods and services produced, grew at a 2.0% annualized pace in the third quarter, according to the department’s first estimate released Thursday. Economists surveyed by Dow Jones had been looking for a 2.8% reading.
That marked the slowest GDP gain since the 31.2% plunge in the second quarter of 2020.
Declines in residential fixed investment and federal government spending helped hold back gains, as did a surge in the U.S. trade deficit. …
The drops mostly offset increases in private inventory investment, a meager gain in personal consumption, state and local government spending, and nonresidential fixed investment.
Consumer spending … increased at just a 1.6% pace for the most recent period, after rising 12% in the second quarter.
This slowdown in consumer spending is not surprising to readers of TheElliott Wave Financial Forecast, a monthly publication which provides analysis of major U.S. financial markets.
Here’s a chart from the September 2021 issue, which was shown in these pages some weeks ago. It’s fitting to show it again. The accompanying commentary is below the chart:
The consumer is clearly out of sorts with the financial optimism of the day. The arrows on the chart highlighting the low in 1980 and the low in August 1982, the orthodox end of Cycle wave IV, show that consumer sentiment led the way out of an economic quagmire at the beginning of Cycle wave V. Now, at the end of wave V, they are even more dramatically leading the way into a new one.
An economist recently argued that the forces which had kept inflation at bay in past years may be starting to fade.
In other words, the increased inflation in 2021 may be more than transitory.
Here’s an excerpt from a Sept. 20 Bloomberg article:
Right now, a lot of the inflation discussion is about fairly short-term factors. Chips. Used cars. Rent. And other categories that are feeling the impact of the pandemic. How long will these categories be on the move? At what point will these moves no longer be considered “transitory?” These are the debates people are having.
Of course, prior to the crisis, inflation had been mild for some time. In a note out on Monday, Michael Pearce of Capital Economics notes some of the disinflationary headwinds that had kept numbers low in recent decades.
Among them are:
• Ongoing technological process • Globalization • Weakening unions • Central banks around the world committed to keeping inflation low
Pearce argues that some, or all, of these trends may be poised to reverse going forward.
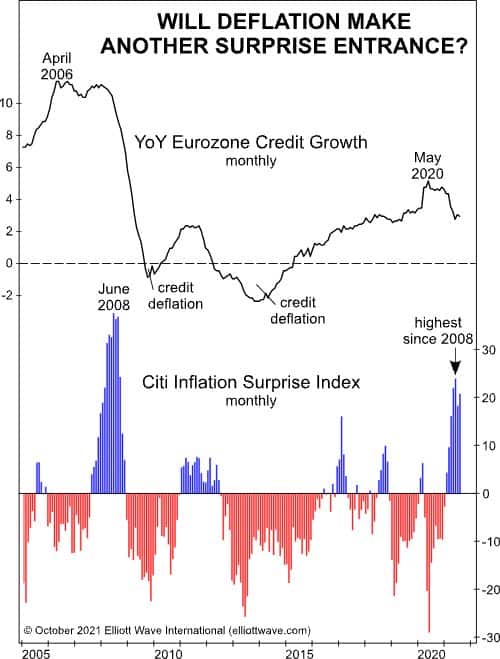
On the other hand, Elliott Wave International’s October Global Market Perspective says don’t dismiss the prospects for deflation. Here’s a chart and commentary:
We remain skeptical that deflation is actually dead, and the top graph on this chart illustrates why. After expanding from 2015 to 2020, eurozone credit growth peaked in May 2020 at an annual rate of about 5% and has since fallen to about 3%. Our skepticism stems from the fact that a similar reversal happened ahead of the 2008-09 financial crisis. In April 2006, credit growth peaked at 11.4% and then plummeted. The metric dipped below zero in late 2009, precipitating the sovereign debt crises that later hit Portugal, Italy, Greece, and Spain. From 2012 through 2014, a broader stretch of credit deflation coincided with a series of banking crises that hit Cyprus. As EWI has long argued, the ebb and flow of credit liquidity is the essential financial metric that moves all markets. Since liquidity is receding again, watching the behavior of various markets will become even more important.
The period of time from 2006 to 2008 illustrates another theme that could be especially relevant today: Credit deflation entered the picture in direct opposition to economists’ expectations. The bottom graph illustrates the Citi Inflation Surprise Index, which measures how far consumer-price movements vary relative to economists’ expectations. The blue bars, for example, show above-zero readings, indicating that CPI inflation came in higher than expected. Red bars, in contrast, show below-zero readings and illustrate lower-than-expected inflation data. In 2008, inflation surprises lagged the downward trend in credit growth by 13 months, accelerating to the upside until June 2008. The index peaked that month but would not record downside surprises until November 2008. The pattern happened again in 2011. Credit growth peaked ahead of the Inflation Surprise Index and went on to record the most significant stretch of credit deflation in Europe’s modern financial era. From 2012 through 2015, inflation data continuously came in below expectations.
Will history repeat itself? As we noted above, credit growth peaked in May 2020, and the Inflation Surprise Index followed 11 months later. If the past is indeed prologue, inflation data should start to surprise to the downside, with outright credit deflation returning in less than a year.
Debt investors demand higher yields when they perceive an increased risk of defaults. This is a sign of a developing deflationary psychology.
With that in mind, China’s dollar junk yields have reached a whopping 20%.
So far, however – Bloomberg says these ramped up default worries are mainly confined to China.
Here’s an excerpt from an Oct. 15 article:
The highest yields in a decade for Chinese junk bonds are not fazing global credit markets.
While contagion risk fears over China Evergrande Group’s deepening liquidity crisis are sending yields on the country’s riskier notes soaring to 20%, other debt markets are so far showing relative calm.
Yields on the broader pool of junk-rated emerging market debt and CCC rated U.S. bonds have been steadier, even as sliding bond prices send yields on Chinese dollar junk notes — a sector dominated by property developers — ever higher.
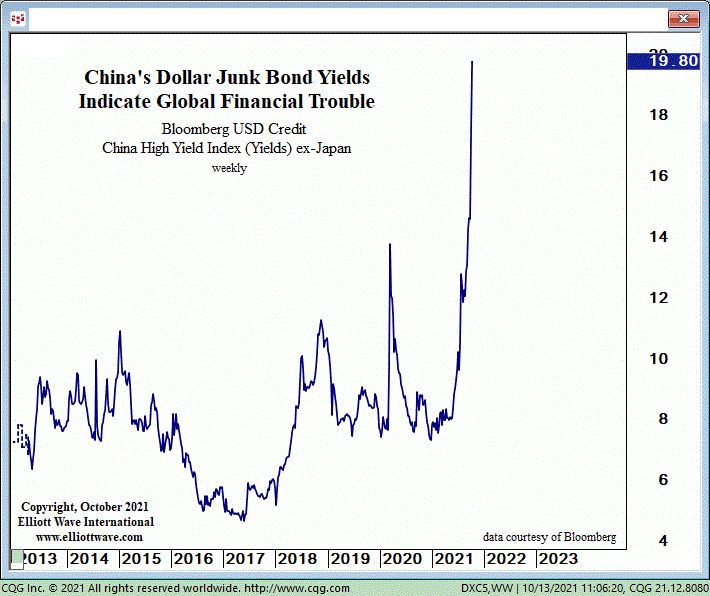
However, Elliott Wave International’s thrice weekly U.S. Short Term Update sees China’s soaring dollar junk yields as a big global warning sign.
Here’s a chart and commentary from the Oct. 13 U.S. Short Term Update (which published when China’s U.S. dollar junk bond yields were just below 20%):
The chart shows the yield on China’s U.S. dollar junk bonds, which are soaring. Since October 1, the day we published [the October issue of the monthly Elliott Wave Financial Forecast], China junk bond yields have shot up from 14.7% to nearly 19.80%, a 35% increase, reflecting the deepening debt crisis that is squashing liquidity. It’s spreading. Besides the de facto bankruptcy of China Evergrande, last week there was a “surprise” default in Fantasia Holdings Group, another Chinese property developer. And EWFF noted the whopping plunge in the shares of Sinic Holdings, yet another Chinese real estate development company. The stock dropped 87% in one day and trading was suspended. After declining to a record low 3.53% on July 6, U.S. junk bond yields just made a new seven-month high, rising 21% to yield 4.27%. This is just the start, in our opinion. Yet there appears to be a complete lack of recognition by investors as to the significance of diminishing liquidity trends in world credit markets. As the bear market progresses, U.S. junk bond yields will eventually resemble China’s junk bond yields as world credit evaporates. The contagion will then spread to higher-grade credits. It’s how bear markets operate.
The price effects of deflation tend to occur in goods and investment assets simultaneously.
Indeed, David Rosenberg, who is the founder of an independent research firm, just wrote an article for the Financial Post (October 8) which is titled:
David Rosenberg: Deflation not inflation will be the topic when housing, equity bubbles pop
Here’s a brief quote from that article, which follows Rosenberg’s mention of the 2008 financial crisis:
The bubble this time around is even more acute, and the reversal in these asset values will hit even harder. The S&P 500’s cyclically adjusted price-to-earnings ratio (CAPE) multiple is 38.3x today and U.S. home prices have soared a record 20 per cent on a year-over-year basis. It now takes a near-unprecedented eight years of wages to buy a new house (the historical norm is closer to five years).
We do not have an inflationary future at all, and this will become apparent not just when these pandemic-induced supply issues are resolved, but when these asset bubbles pop. And they will pop.
Elliott Wave International agrees that a major reversal in equities and the housing market is at hand.
Regarding the U.S. housing market, here’s what the September Elliott Wave Financial Forecast had to say:
The downturn in prices from June is still just a blip, but there is further evidence of a dramatic change of tone in the market for homes. A survey by Redfin confirms that prices fell 0.2% in the four weeks ended August 1. “This is the first sign of the price rally petering out,” says Business Insider. The mad scramble, which had buyers piling into homes without the benefit of inspections or even in some cases seeing their new home, has also abated, at least a bit. According to Redfin, just under half of homes that went under contract in the last four weeks of July had an accepted offer in two weeks. That’s the first time the share fell below 50% since February. Also, for the first time since October 2019, the share of sellers dropping their price surpassed 5%. As in 2006, housing market economists say “homebuying demand remains strong and the market is tipped heavily in buyers favor.” We offered some anecdotal evidence of the frenzy in our area last month. Here’s an update from The Atlanta Journal-Constitution on August 26: “Metro Home Prices Flat—For Now.” According to the experts, the lull represents an “equilibrium that may prove short lived.” So they say. Our stance is that it will soon be replaced by an even more enormous crater than that of 2006-2011.
The doubling of consumers who say it is a “good time to sell” compared to 2006 is powerful confirmation of this outlook. It tells us that the astounding psychological power of a progressing mania continued to build, at least through June. When surveyed, many consumers recognize the current moment as a great opportunity to sell, but how many will? The answer is very few. Instead, many are rushing into second, third, or in the case of one retired couple profiled here last month, a 21st home. In a bid to make “second home ownership possible for more people,” a start-up company called Pacaso sells shares in a “corporatized house. The buyer gets one eighth of a share of ownership and the right to stay in the house 44 nights per year.” Back in the day, a preponderance of “odd lot” stock buying, units of less than 100 shares, was a dependable sign of an impending market high. Now that homes are being fractionalized, the stage is set for a very big reversal.
U.S. consumers are growing more pessimistic about the economy.
Indeed, the latest drop in the Consumer Confidence Index has reached a seven-month low.
Here’s an excerpt from a Sept. 29 article in TheHill:
The Consumer Confidence Index, a key indicator that offers a glimpse into purchasing attitudes among U.S. consumers, recorded another decline in September, continuing the streak of decreases seen in both August and July, according to new Conference Board data.
Falling to 109.3 from the 115.2 recorded in August, the new number indicates persistent pessimism among U.S. consumers, which in turn indicates lingering doubts about their individual finances. …
This most recent decline is now a seven-month low, according to calculations from Reuters, with these most recent readings being the lowest recorded since February.
American consumers also feel pessimistic surrounding the current business conditions in the U.S. Measured by the Present Situation Index, 19.3 percent of consumers described the business climate to be “good,” a drop from the 20.2 percent seen in August.
Is this a sign of a deepening deflationary psychology?
This is from Robert Prechter’s book, Conquer the Crash:
The psychological aspect of deflation and depression cannot be overstated. When the trend of social mood changes from optimism to pessimism, creditors, debtors, investors, producers and consumersall change their primary orientation from expansion to conservation.
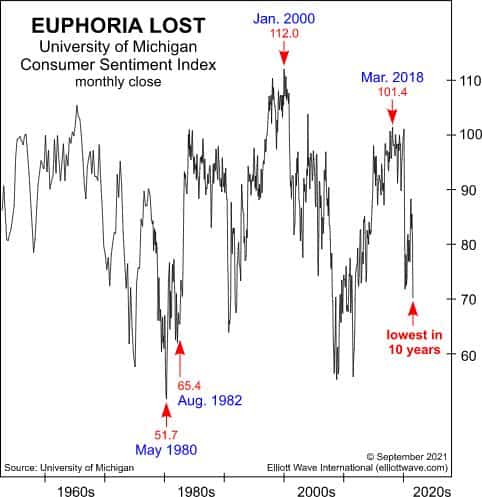
When the Sept. 3 Elliott Wave Financial Forecast published, the latest consumer confidence data was for August. Here’s a chart and commentary from that issue of the Elliott Wave Financial Forecast:
In June 2000, The Elliott Wave Financial Forecast pointed out that the University of Michigan Consumer Sentiment Index … does a pretty good job of sussing out the prevailing direction of social mood.
The main trends in consumer confidence have always been tuned to stock prices.
…. The arrows on the chart highlighting the low in 1980 and the low in August 1982 … show that consumer sentiment led the way out of an economic quagmire at the beginning of Cycle wave V. Now … they are even more dramatically leading the way into a new one.
Do you fear that the U.S. is headed for a deflationary scenario akin to what Japan has been going through?
If so, as the saying goes, “there’s an ETF for that.”
Here’s an excerpt from a Sept. 21 Bloomberg article headlined “Nancy Davis Flips to Deflation in New ETF After $3 Billion Haul”:
Nancy Davis has lured billions to her ETF guarding against inflation. Now she’s looking to repeat that success with a product betting on the other side of the trade.
Her firm, Quadratic Capital Management LLC, is launching the Quadratic Deflation exchange-traded fund (ticker BNDD), it said in a Tuesday statement.
The new product will seek to profit in an economic climate of falling prices, weak growth and negative long-term interest rates. Like its established sibling with the opposing mandate — the Quadratic Interest Rate Volatility and Inflation Hedge ETF (IVOL) — the strategy aims to deliver by trading a mix of Treasuries and options.
“Some investors have expressed concerns that the U.S. will experience an environment similar to Japan given the debt increase and labor market,” Davis, who will manage the new strategy herself, said in the statement. “It’s prudent for investors to have tools available to them so that they are prepared for a wide range of economic outcomes and environments.”
Markets have been fretting over inflation for months on the risk that price pressures could prove less transitory than the Federal Reserve expects. Yet as key measures of reflation ease from multi-year highs, Quadratic is betting investor attention will return to the long-term deflationary forces of the pre-pandemic world.
Of course, no one knows how a particular exchange-traded fund or any other investment will perform.
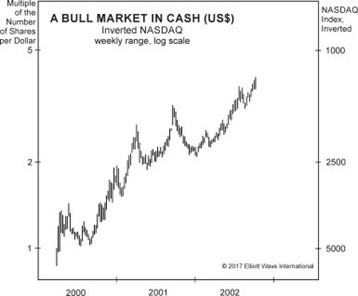
Yet, Robert Prechter does mention a “safe asset” that “assuredly rises in value during deflation” in his book, Conquer the Crash (2020 edition):
Today, few people give cash a thought. Because interest rates on Treasury bills are “too low,” investors claim that they have “no choice” but to invest in something with “high yield” or “upside potential.” Ironically but obviously necessarily, the last major interest-rate cycle was also perfectly aligned to convince people to do the wrong thing. In the early 1980s, when rates were high, people thought that stocks were not worth buying. Now that rates are low, they think that T-bills are not worth holding. It’s a psychological trap keeping investors from doing the right thing: buying stocks at the bottom (when rates were high) and selling them at the top (when rates are low).
Now let’s dispose of the idea that the return on cash is always “low.” … [The chart below] is one picture of the rising value of cash in the United States, which appreciated 287 percent from March 2000 to October 2002 in terms of how many shares of the NASDAQ index it could buy.
Wouldn’t you like to enjoy this kind of performance, too? You can, if you move into cash before a major deflation. Then when the stock market reaches bottom, you can buy incredibly cheap shares that almost no one else can afford because they lost it all when their stocks collapsed.
Cash is the only asset that assuredly rises in value during deflation.
Also, in Japan, the value of cash appreciated 400% in terms of how many shares of Japanese stocks it could buy from 1990 through 2008.
Japan’s decades-long battle with deflation persists, despite past pledges by government officials to defeat it.
Now, two contenders to become Japan’s next prime minister join the list of those who’ve offered stimulus plans.
This Sept. 7 Bloomberg article excerpt provides details:
Two lawmakers battling to become Japan’s next prime minister both pledged to launch stimulus packages over the short term and to defeat deflation over the longer term, as they laid out their platforms Wednesday.
Former Foreign Minister Fumio Kishida said he would inject tens of trillions of yen (hundreds of billions of dollars) to help a Covid-battered economy, as he set out his policies in the race for leadership of the ruling Liberal Democratic Party.
Rival Sanae Takaichi, who is seeking to become the country’s first female prime minister, also said she would swiftly consider an extra budget to aid the economy, though she refrained from putting a figure on the size of the package. The amount would depend on how much was really needed and required careful consideration, she added.
Takaichi, a former economics professor, said she would prioritize the country’s 2% inflation target over achieving a primary budget balance. She said the government’s preoccupation with trying to balance the books had contributed to the failure to reach the target so far…
In his 2020 edition of Conquer the Crash, Robert Prechter provided a historical perspective on Japan’s economy as well as past stimulus efforts by Japanese authorities to defeat deflation:
Japan had one of the strongest economies in the entire world, growing at a 9% rate for 20 years up to 1973, and then a pretty strong rate of about 4.5% through 1994. From there, it’s averaged about 1%.
The reason Japan is in trouble was expressed in a November 1, 2012 headline from MarketWatch: “Japan Is in Worse Than a Deflationary Trap.” But it’s not worse than a deflationary trap. It’s just a deflationary trap. Here’s what the article says: “Policy makers have spectacularly failed. Brutal deflation persists.
Japanese officials tried monetary stimulus, including zero interest rates and quantitative easing.” Does that sound familiar? And here: “Past fiscal stimulus has ballooned the national debt to 200% of GDP.” Does that sound familiar, too? And finally, “The most troubling aspect of Japan’s malaise may be psychological.” That’s the key to the whole thing. When social mood changes psychology from ebullience to conservatism, a trend of expanding credit shifts to a trend of declining credit and therefore inflation into deflation.